Market environment is frequently characterized by herding behavior. The global markets are linked today with each other like never in the past because of globalization due to technological advances. Most traders and investors use a single market analysis approach when investing or trading in the financial markets. For example, a stock trader will look at the S&P 500 or the Dow Jones industrial average. A currency trader will look at the Euro, the British Pound or the Japanese Yen. At Rios Quant we utilize multi-market analysis which involves the analysis of the main asset classes in the financial markets: equities, fixed income, commodities and currencies. To effectively use multi-market analysis you need to have a good understanding of correlation analysis. It is how the four major markets interact with each other that gives this type of analysis predictive value. Here are some basics on how they should interrelate:
The US dollar trends in the opposite direction of commodities, a falling dollar is bullish for commodities, a rising dollar is bearish for commodities. Commodities trend in the opposite direction of fixed income prices. Therefore commodities trend in the same direction as interest rates. Rising commodities coincide with rising interest rates and falling bond prices. Falling commodities coincide with falling interest rates and rising fixed income prices. Fixed income prices sometimes but not all the times trend in the same direction as stock prices. That relationship is going to be dependent on where we are in the economic cycle and the economic environment. During the current economic environment fixed income prices have been trending opposite of stock prices. Fixed income market also referred to as the bond market normally changes direction ahead of stock prices. The direction of the US dollar is also going to be dependent on the economic cycle. There are times where a rising dollar is good for US stocks, and other times it’s the opposite. Currently a falling dollar is good for US stocks. Depending where we are on the economic expansion or contraction the relationships between different asset classes/markets will vary.
Risk-on an risk-off phrase that has been very much in the media is a result of multi-market relationships. The more we are global in the financial markets the more opportunity exists for anticipating price movements based on multi-market relationships and correlation analysis. Risk-on and risk-off really means when an extreme state of the market when correlation of all assets are perfect. The RQ-Tech Analyzer can serve as a compass for our decision making process when we believe that we are moving towards or away from a risk-on risk-off environment. Ever since the global financial crisis came to a head in 2008 risk-on risk-off and the idea that correlations went “to-one” or as we also phrase it “in-sync” have become the most widely used phrase in describing asset class/market price behavior. Looking back, 2008 was a risk-off year in which the investment community were said to have reduced their exposure to risk assets by deleveraging and/or by selling existing risk assets and going to cash. For a good part of 2009 we were in a risk-on environment as some investors appetite for risk returned leading to a synchronized strong rebound of returns in risk-on assets ranging from global equities, commodities and risk currencies. In early August 2011 Standard & Poor’s downgraded sovereign credit of the United States triggered a global selloff of risk-on assets for days, a risk-off environment. Depending on the environment, investors will tend to buy or sell risk assets across the board, paying less attention to the unique characteristics of these assets. Volatility and most noticeably, correlations of assets that are perceived as risk can potentially spike or selloff during risk-on risk-off periods, as we often hear the phrase “correlations to-one”. On the other hand assets such as U.S. Treasuries including notes and bonds and some currencies such as the US dollar tend to move in the opposite direction of risk assets, as they are generally perceived as the safer assets to hold in the event of a flight to safety.
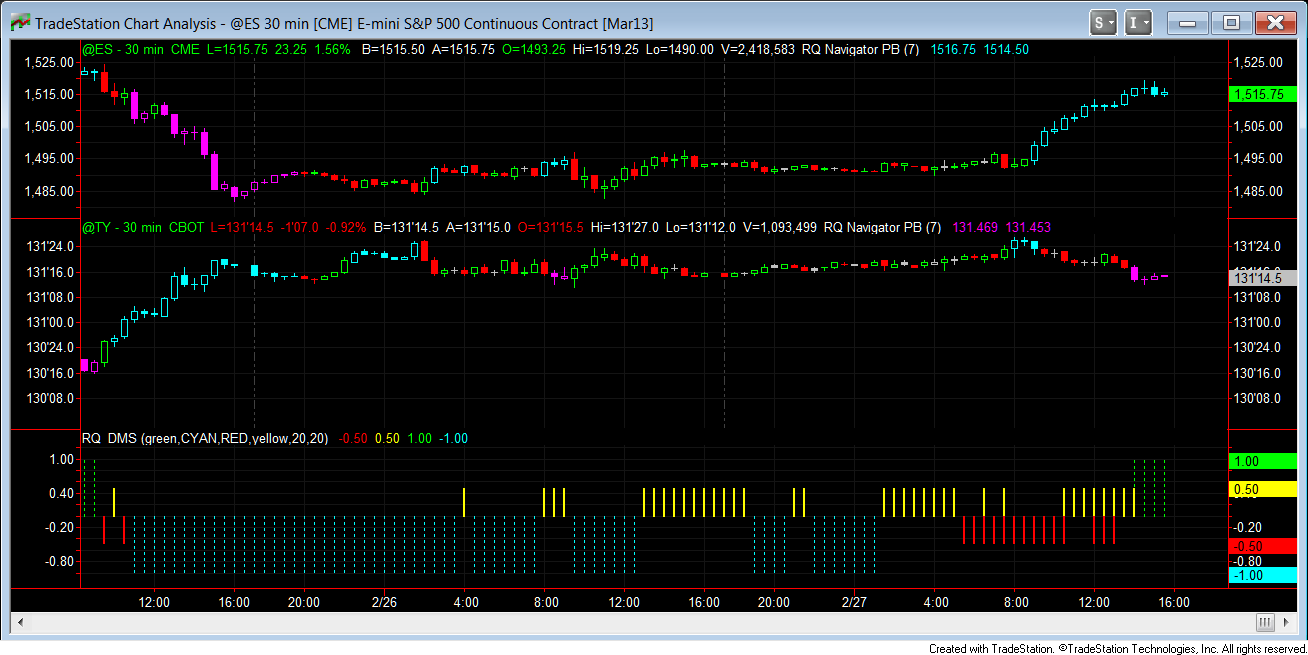
The above chart displays the correlation between the S&P 500 and the US Ten Year Note. The histogram in the bottom of the chart is the RQ Dynamic Market Sentiment indicator (RQ-DMS) plotting various market conditions including risk-on risk-off, in-sync, conflict and mixed markets.