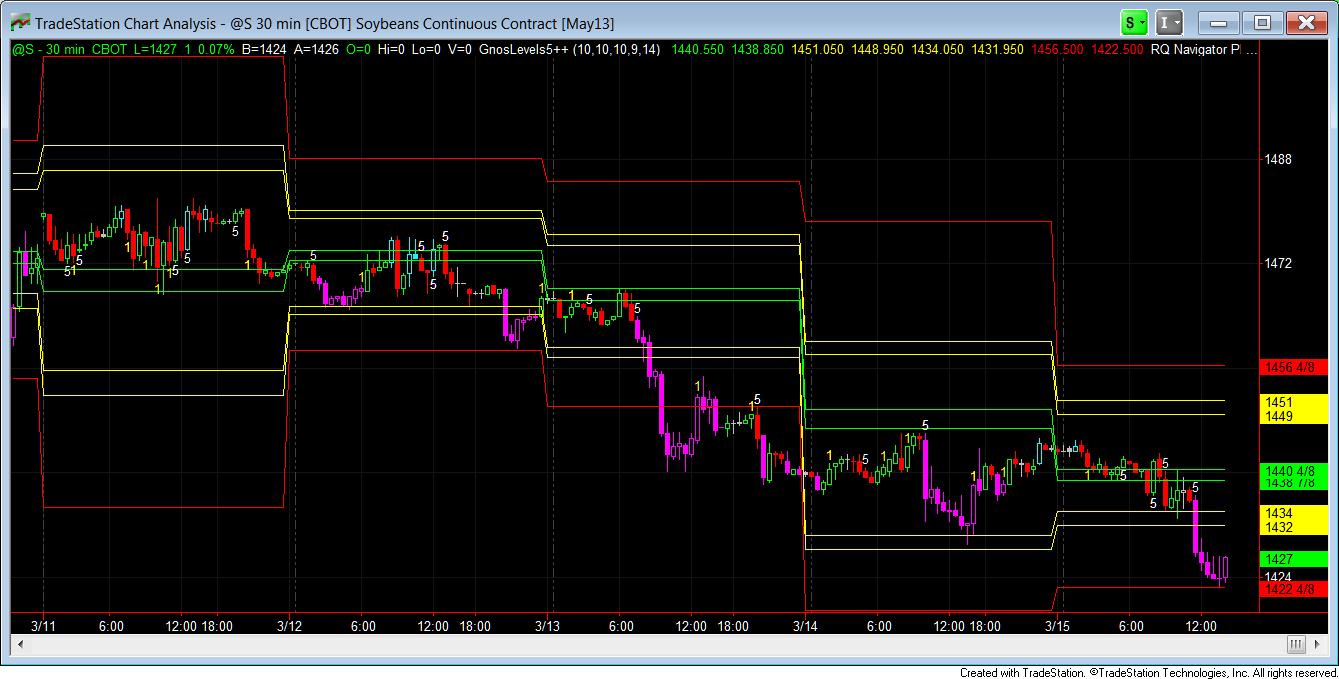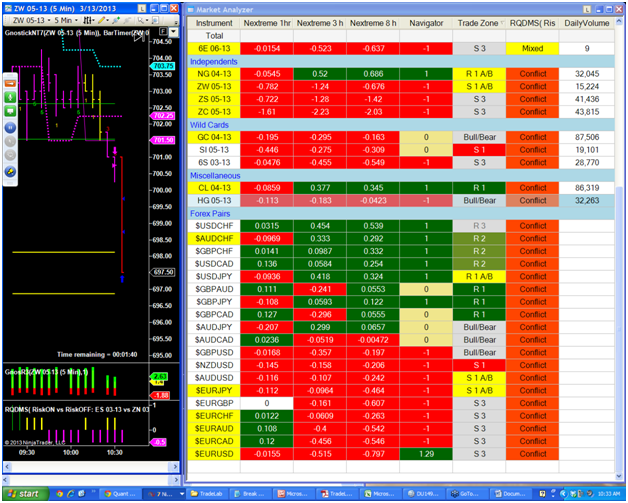
Price action in the financial markets this past week left many active traders with bruised egos as the markets were mostly range bound and choppy. The RQ-DMS, our dynamic market sentiment indicator identified choppy market trading conditions 4 out of 5 trading days for the week. The only day the markets were in sync, with risk-on environment in control, according to the DMS was Thursday the 14th. For the astute RQ trader, when markets are in conflict or mixed, we turn our attention to the independent and wildcard asset classes. While the S&P 500 and the US 10 Year Notes respectively gained 0.5% each, Natural Gas gained 6.4% while Soybeans dropped -3.1% for the weeks relative performance. Also, Natural Gas was the only instrument in the Riosquant.com site to have a bullish quant ranking in the RQ-Cross Box for the week. Risk assets should be in the spotlight in the week ahead, with anticipation of a breakout or breakdown from the recent tight trading ranges.
It was no surprise for me to hear this past Friday during an interview on CNBC squawk box, former FOMC Chairman Alan Greenspan say he starts his trading day by first looking at the futures market as well as the bond markets. In the week ahead my focus will be on the FOMC meeting on Wednesday as they announce policy and release an updated summary of economic projections and Chairman Bernanke will hold a press conference. Take note that the Fed announced a time change for the statement and news conference. You might see some price action in the risk assets as we approach the FOMC event. Traders might be adjusting positions as expectations may change leading up to Wednesday.
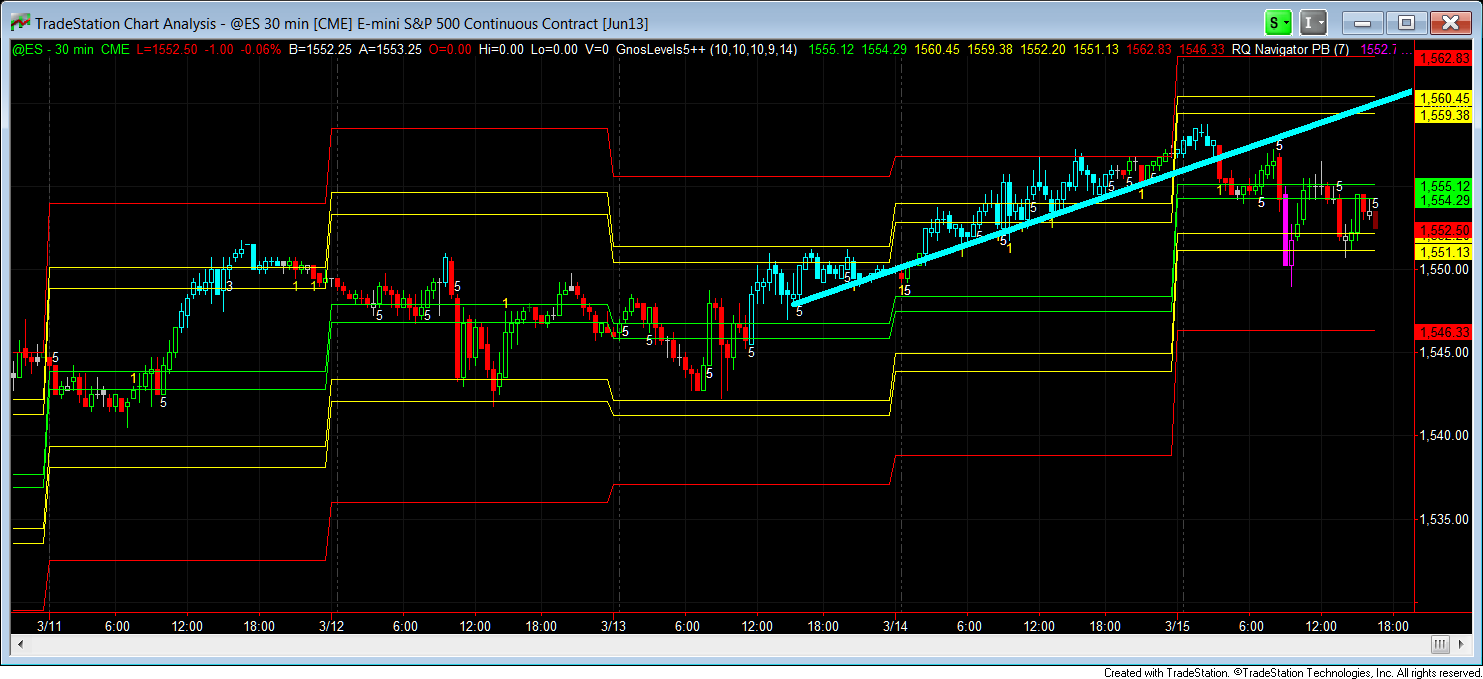
For most active traders, especially momentum traders, range bound and choppy price action conditions is a major threat to performance. The RQ-Navigator is designed to identify and alert you when markets break out or down from their recent trading ranges. When combined with the market selection process utilizing the RQ-DMS, you stack the odds more in your favor and not against you. Below are charts to give you a visual of the RQ-Navigator depicting range and breakdown markets.
Following is a comment from one of our members regarding his trading experience for this past week.
“Entering trades in a range bound area and those trades taken caused multiple whip actions by me trying to stay on the right side of the trade which ended up in 2 back to back losses per trade. This happened 4 times over the course of the 4 days that I was able to trade. Then one larger successful trade which got the money back, but very little profit because the goal was to get the money back. Then I made the mistake of not letting the trade do what it was supposed to do which is run, which in each case it did. So, one mistake, compounded into 3 mistakes… although the week was profitable, not recognizing that the market had gone into a range (barb wire), was costly. ”