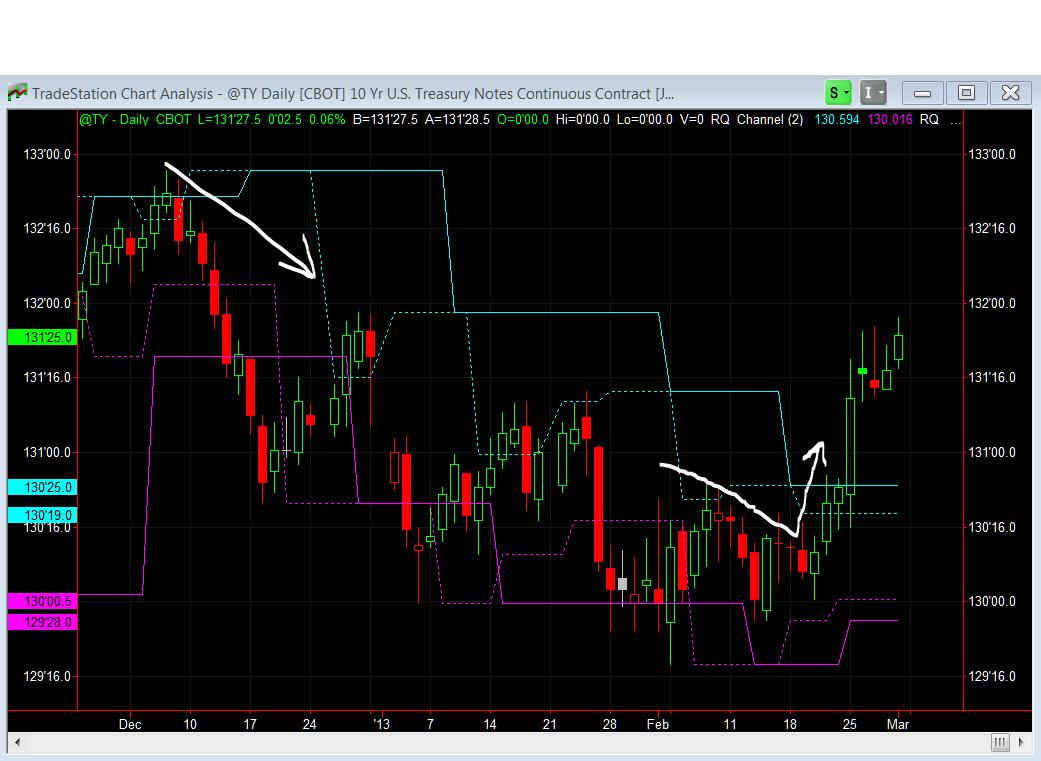
Efforts to avoid US government spending cuts were aborted on Thursday, as both bills put forward by opposing parties failed to pass the Senate. The US equity markets sold-off on Monday only to regain the losses by Wednesday’s close, eventually ending the week flat indicating indecisiveness from market participants – chart #1. The US Dollar and US Ten Year Note strengthened with RQ-Channel bullish breakouts while commodities weakened as Risk-OFF sentiment prevailed in most asset classes – chart #2. The Euro closed the week at a key technical support level as pinpointed by the RQ-Channel making the Euro my main focus in the week ahead – chart #3. The currency markets should dominate the calendar headlines starting with the Eurogroup finance minister’s meeting on Monday and later in the week the ECB will make its latest policy decision with a backdrop of weak economic growth and Italian political conflict.
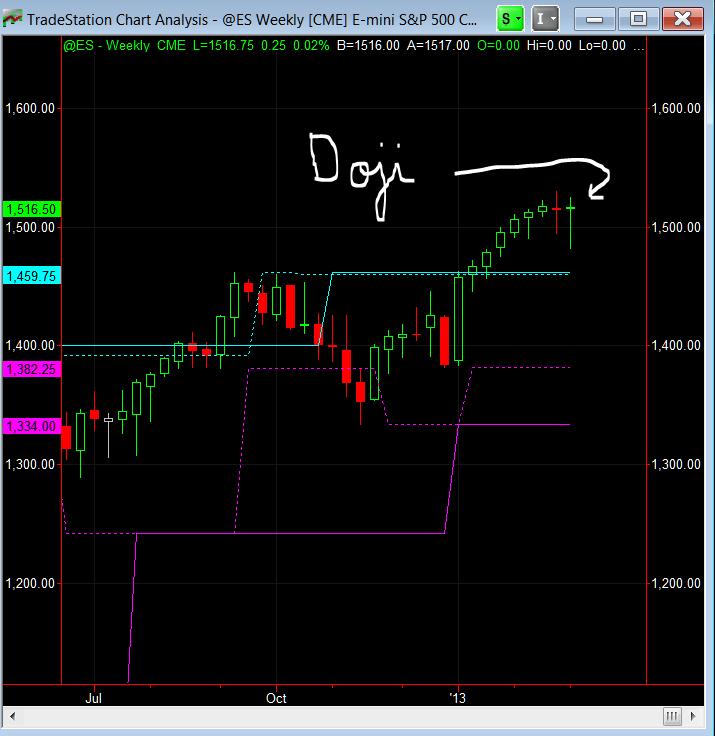
Chart #1 – The S&P 500 closed the week with a dragonfly Doji Japanese candlestick formation indicating indecision between bulls and bears. At a market top, a Doji can be an early warning of forthcoming volatility.

Chart #2 – The US dollar index brokeout as illustrated by the RQ-Channel 7 indicator after a bullish double bottom reversal pattern formation.

Chart #3 – The Euro finished the week at a key psychological and technical level. Monday the 18th of February a head and shoulder pattern description with a bearish quantitative ranking was published in the RQ Cross Box section of the RiosQuant.com site. The head and shoulder pattern is generally regarded as a reversal pattern and it’s most often seen in uptrends. It is also most reliable when found in an uptrend, also indicated during the past couple weeks in the RQ Cross Box trend direction box. Like in most H&S formations, the market begins to slow down and the forces of supply and demand are generally considered in balance. Bears come in at the highs (left shoulder) and the downside is probed (beginning neckline). Bulls soon return to the market and ultimately push through to new highs (head). However, the new highs are quickly turned back and the downside is tested again (continuing neckline). Tentative buying re-emerges and the market rallies once more, but fails to take out the previous high (last top is considered the right shoulder). Buying dries up and bears again gain control and the market tests the downside again.