The tiny island of Cyprus dominated the headlines this past week. As the markets opened for first day of trade, risk assets gapped sharply only to retrace its losses towards the end of the week. Euro area finance ministers meet today, to decide whether the Mediterranean island has done enough for a bailout that may avert its financial collapse. Risk assets especially the equity markets remain vulnerable, so in the week ahead be watchful for any headline news including schedule speeches from New York Fed President Dudley, Fed Chairman Bernanke and Boston Fed President Rosengren.
On a relative performance basis Natural Gas 1.7% and Corn 1.3% outperformed while copper -1.5% underperformed this past week. The unrelated risk asset classes (independent and wild cards) continue to provide trading opportunities, especially when the markets are in conflict or mixed. When the markets are in sync with risk-on and/or risk-off sentiment, choosing to trade the out performers for buy long candidates and the under performers for selling short candidates, continues to provide better odds for directional trades. The following charts will help illustrate the correlation and tactics In selecting optimal asset classes to trade using the RQ Dynamic Market Sentiment indicator with the RQ-Channel 7 breakout indicator.
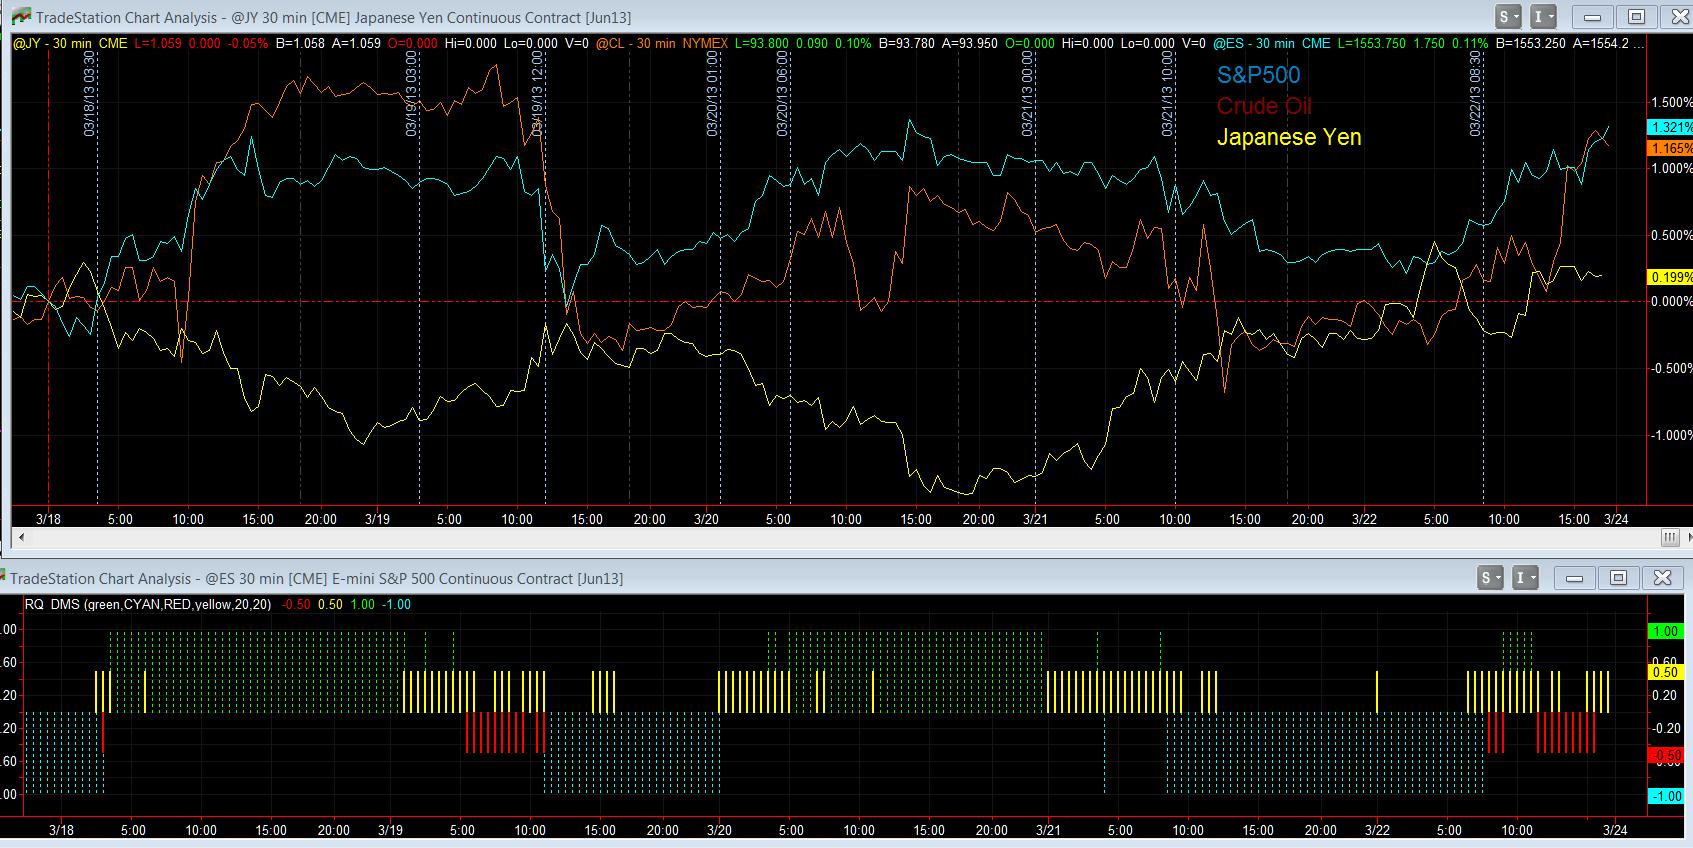
Click on chart to enlarge view
The chart above illustrates relative performance during this past week between the S&P 500, Crude Oil and the Japanese Yen. The lower section of the chart is the RQ-DMS (dynamic market sentiment indicator). In the RQ-DMS take notice when the histogram is green, a risk on sentiment environment, risk-on assets as demonstrated by the S&P 500 and Crude Oil ascended while the Japanese Yen, a risk-off currency descended. The blue in the histogram illustrates risk- off sentiment, the yellow is for mixed markets and the burnt orange is for markets in conflict. Early in the week when the RQ-DMS identified risk-on sentiment Crude Oil was the outperformer identifying a strong buy long candidate. Conversely, the following trading session, as soon as the markets turned to risk off sentiment, Crude Oil was the underperformer identifying a strong sell short candidate. Later in the week during risk-off sentiment Crude Oil sold off sharply providing another strong sell short opportunity. Based on these charts the most clear opportunities occurred during transitions from mixed markets and/or markets in conflict to markets in sync, including both-risk on and risk-off market sentiment indications.
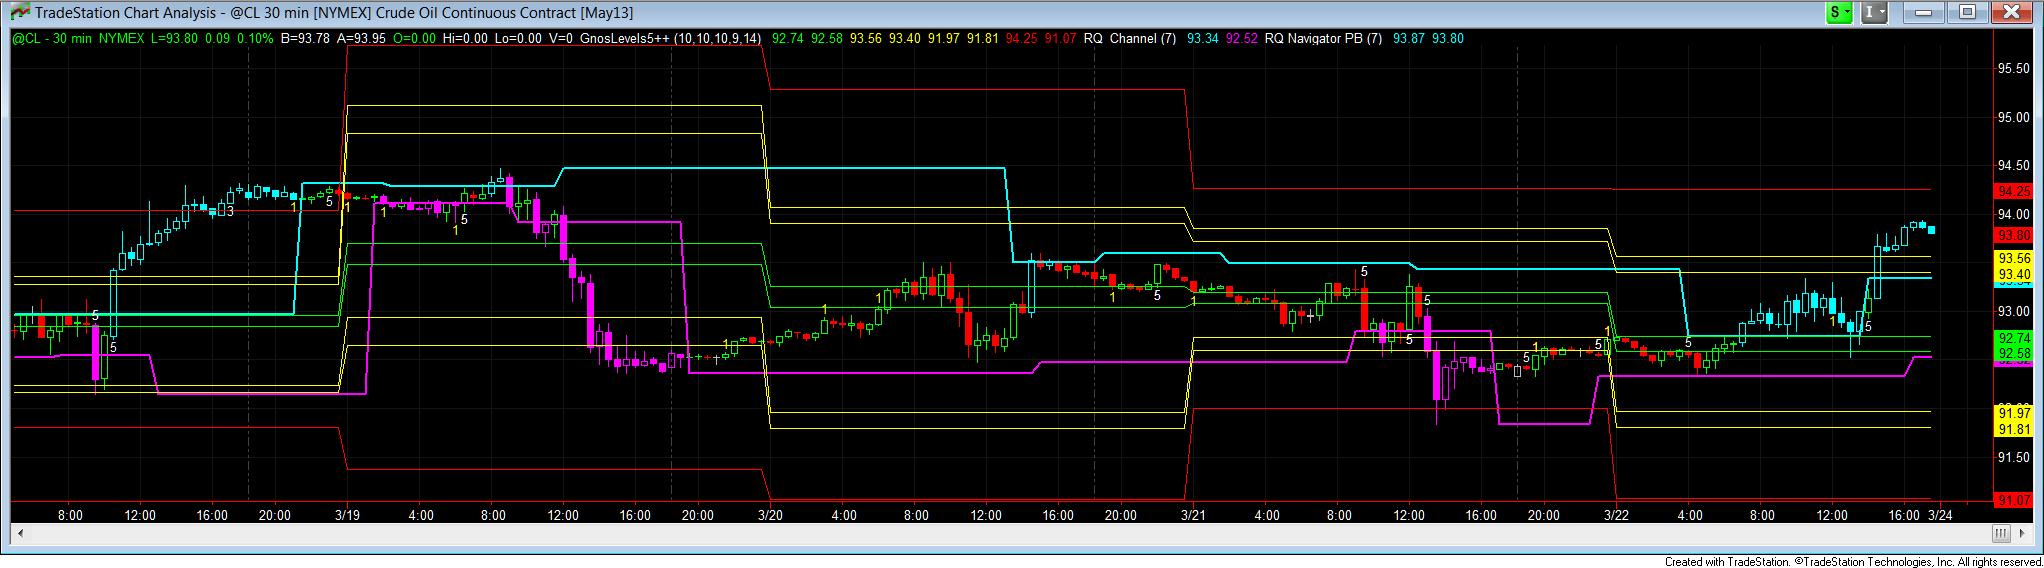
Click on chart to enlarge view
The chart above illustrates last week’s price action for Crude Oil with the RQ-Channel 7 breakout and breakdown indicator. The most clear trading opportunities for crude oil occurred during risk-on and risk-off market sentiment. Selecting to trade the outperforming asset classes for buy long opportunities and conversely selecting the underperforming asset classes for sell short opportunities in combination with market sentiment should increase your odds on directional trades. The RQ-Channel 7 signals occurred when price bar turned cyan color for buy entries and magenta color for short entries.
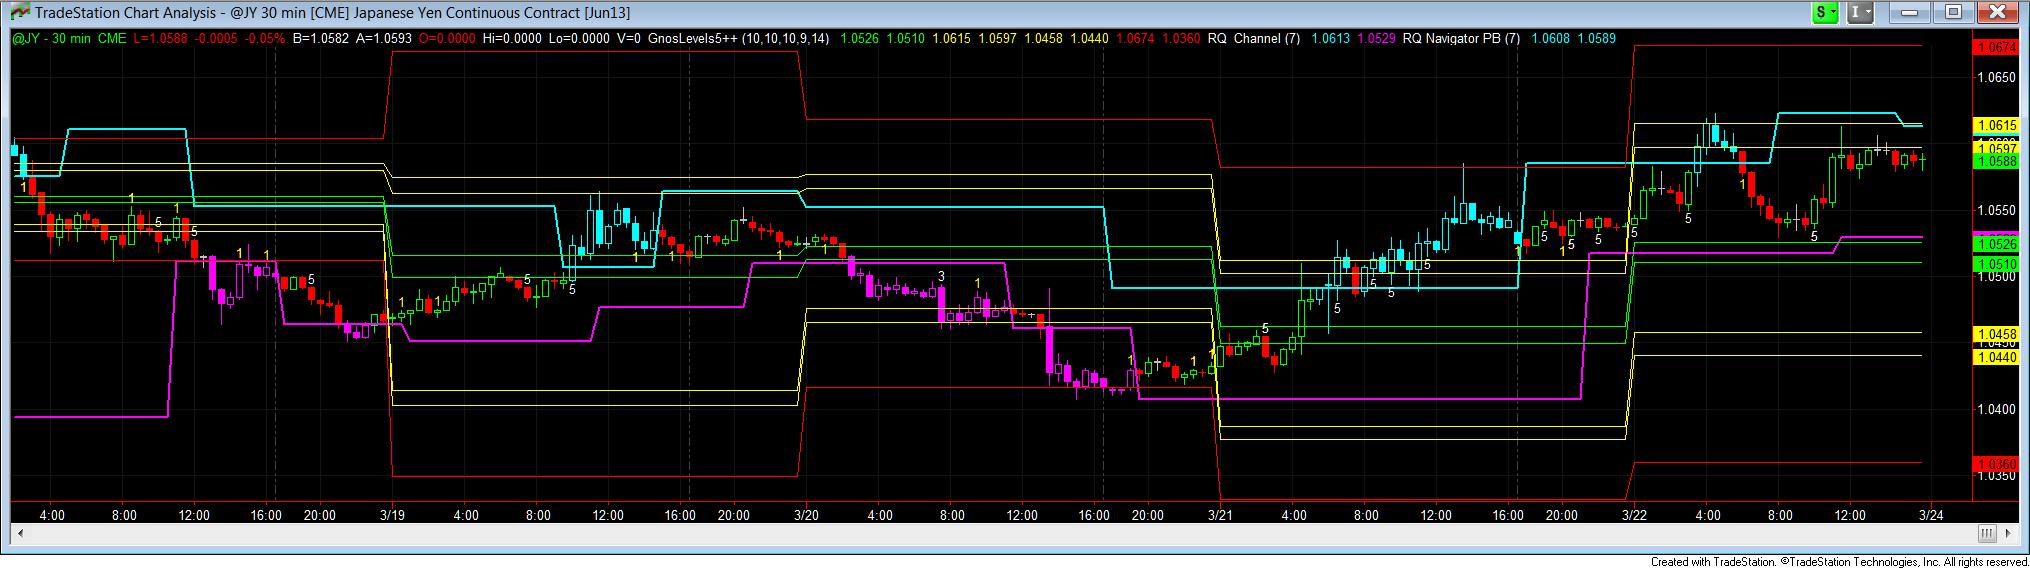
Click on chart to enlarge view
The above chart illustrates the Japanese Yen with the RQ-Channel 7 signals for buy long and sell short entry opportunities when taken in the same direction as the RQ-DMS indicates.
For more information feel free to contact me at joegrios@gmail.com or support@Riosquant.com.